Data Visualization Resume Sample, Example & Writing Tips 2024
One of the most specialized fields in big data is data visualization. It involves taking complex data and making it aesthetically pleasing and easy to understand. If you’re applying for a job as a data analyst or data scientist, you need an excellent data visualization resume.
Since you know how to make data look good and deal with it regularly, that needs to be emphasized throughout your data visualization resume. When the resume looks good and has all the important information, you’re much more likely to gain the attention of a hiring manager and get hired into your dream job.
If you want to knock the socks off of a potential employer, we have tips, examples, and samples to help you. We’ll walk you through the full process of building an outstanding data visualization resume. Once you’re done, you’ll have a resume that shines. Then all you need to do is add your other attachments and wait for a call.
Data Visualization Resume Sample
Positions in data visualization incorporate analysis of data followed by creating a visual representation of your findings. Experts in the field use datasets to create maps, pictures, charts, graphs, and more. These items should be readable and accessible to anyone. Looking at data visualization resume examples can show you how to put your expertise on paper.
Data viz jobs are available in a variety of fields. All businesses can use someone who understands business patterns and trends. A few of the industries that most commonly hire data visualization experts include the following:
· Education
· Engineering
· Finance
· Government
· Marketing
· Medicine
· Science
· Software development
You’ll see that data visualization expert resume examples allow applicants to demonstrate an array of skills and experience related to data analysis, data collection, and data interpretation. In addition, this professional document may have insight into the direct experience of using specific software programs to morph data into visuals. Your data visualization resume will also give details about accomplishments you’ve had in the past.
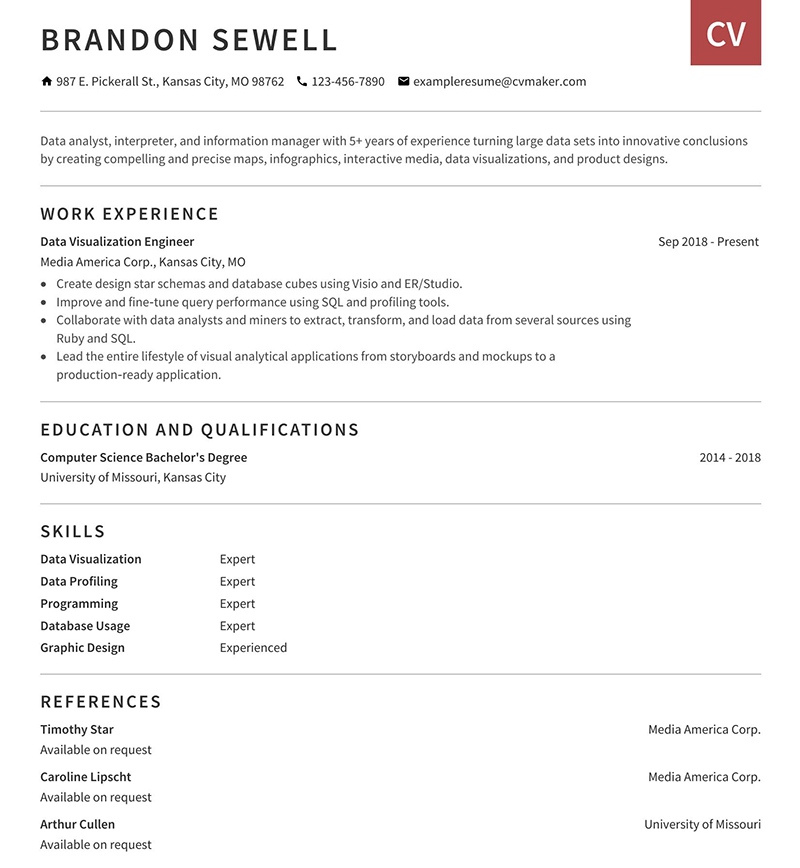
Since examples are an important part of the process, we’ll be sharing an entire resume below for a data visualization expert. You can take in the entirety of the document and see what yours might look like. In addition, as we take you through the sections of a data viz resume, we’ll also have samples for each of those.
Download this resume example - Data Visualization
How to Write a Good Resume for Data Visualization: Tips That Work in 2024
You might be wondering how to write a data visualization resume that stands out. It might seem like a challenge since there’s so much you feel you need to say. However, there are a few things to keep in mind as you get started with the process. It will make it easier for you to finish the document and feel proud of the final result.
One of the first things to do before starting your resume for a data visualization analyst is to read over the job description for the position you’d like to acquire. The data visualization job description will give details about the qualifications and skills that the company wants in the person they hire. When you weave those into your resume, it shows you’d be a great fit.
From there, you’ll start by adding your contact details. This will give an introduction to you and provide a way for employers to contact you. This is an important section to get right as it helps the hiring manager easily communicate with you and keep your paperwork organized. As such, choose contact methods that you use regularly.
Next, you will want to add a resume objective for a data visualization developer resume. This is where you outline your largest achievements throughout your career. This will be anywhere from one to four sentences with specific information about your job title and the experience you have. This is a good way to show you’re an excellent choice for the job.
Beyond that, your data visualization specialist resume will show your work experience. Adding details about each is important to show your job duties and achievements. Being detailed lets a hiring manager see the positive impact you’ve had in past positions. Metrics and KPIs should be added as evidence of what you can do.
Your education will also be part of the data visualization resume. No matter your level of experience, this is a section that employers expect to see. This is also useful since some positions require certifications or advanced data visualization or analytics degrees.
The last two things that compose a typical data viz resume are your skills and a list of references. For skills, you’ll want to show all the things you’re good at concerning data. This provides more evidence that you’re a good candidate for the position. References are largely self-explanatory but more details will be included below.
Get started below by filling out your contact information!
Section #1: Contact Information
Sure, you want to show off your business intelligence with your resume. However, step back a second before we delve into all of that information. First, you need to be sure the hiring managers know who you are as a person. That doesn’t mean you need to share your life story, but what you do need to provide is contact information.
This section is a great place to start because it’s simple to put together. Your basic personal information is included along with at least two ways for someone to get in contact with you. You can see what this might look like below.
Contact Information Example

In the example above, you can see how this section looks on the page. It has all the needed information, which includes your first and last name as well as your address. A full address is most common but a country and state also work if you prefer that. While it might seem impossible to get this wrong, make sure you go over it for typos.
In addition to sharing who you are and where you’re from, you also need to add two methods to contact you. This is typically going to be an email address and phone number, but feel free to switch things up as needed. The important thing is that a manager can easily communicate with you. Adding on other info, such as a LinkedIn profile, can also be done.
How to Format This Section
As someone who works with large data and does data analysis, you likely have an eye for good design. That’s useful when formatting this section, as well as the ones we’ll be talking about later in this article. For the contact information, the formatting is pretty minimalist. Make sure the font is legible and professional for all the information.
Beyond that, you can use some bold to highlight certain areas of the contact info. For example, the header might be larger than the other information. While you’ll get to be more creative in other sections, the important thing, for now, is to be clear and share who you are and the best way to reach you.
Section #2: Resume Objective
Moving on, we’ll be looking at the data visualization resume summary. This is one of the most important sections to get right. What you write here will largely determine whether someone keeps reading the rest of the resume. Do what you can to avoid being dull. Use action words and achievements to energize the objective.
The basic purpose of this section is to sell yourself. You want to put your highest achievements and most impressive accomplishments here. At the same time, this is a short section so going overboard is the wrong answer. You’ll get a better idea of how this looks below.
Resume Objective Example

Whether you’re creating a data visualization resume for a fresher or someone with lots of experience, the resume objective is super important. Above you can see how this section typically looks. You’ll notice that this is an understated section that focuses on content much more than data.
You’ll see the applicant notes the things they’re best at and you can do the same. Whether you are great at data sets and interactive graphs or working with an SQL server, this could be the place to add it. Focus on things that are desired based on the job description.
How to Format This Section
This part of the data visualization resume is the one that needs the least formatting. It’s a short paragraph of text and it doesn’t need any enhancement. The words are what should be the focus here. This should be a short paragraph of no more than four sentences.
Section #3: Professional Work Experience
Now we move into data visualization experience for a resume and the best way to convey that to a potential employer. While you’ve already shared some of your top achievements, this section focuses on specific work experience. Whenever possible, include experience that relates to data visualization and similar positions.
For those who have little to no work experience in the field, you can add other employment you’ve had in the past. If you are coming straight out of school, include any internships, volunteering, or projects you may have done. Otherwise, this section will look similar for all data viz resumes.
Professional Work Experience Example
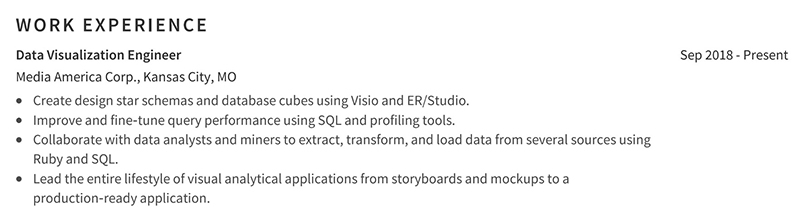
You can see the applicant here has several years of experience forecasting, analyzing, and visually presenting data. While their experience section has a single job, you can add more if you have worked for several employers. Just use the most relevant ones to show you have handled the same things as needed in the new position.
This section should be laid out in reverse chronological order in most cases. That means the most recent position comes first before working your way back. Compared to the first two sections, this one is a bit more in-depth since hiring managers are especially interested in what you’ve done in the past.
How to Format This Section
As a Tableau developer who can create an exceptional infographic for data, there are several formatting tips to keep in mind. When it comes to professional experience, you want a heading that includes where you worked, what your role was at the company, and when you were employed there. Using different colors can help make this information stand out.
Underneath the basic information about the job, you’ll want to use bullets to make a list of your responsibilities. This tends to work better than a paragraph. It’s simpler for a manager to skim and get information about what you are capable of. Then all you need to do is start over for your other past jobs.
Section #4: Educational Background
Whether you have a high school diploma, a bachelor’s degree in computer science, or specialized certifications, those go under the educational background section. Assuming you have a degree from a university, you can skip adding your diploma. However, all higher degrees and certifications should be listed.
While experience is one part of being the right choice for a job, your educational background can also play a part in things. Since data management, data warehouse optimization, and working with Tableau are all specialized abilities, employees want to see you understand what the position entails. So let’s look at an example and talk about tips for this section.
Educational Background Example

This example from a data analyst resume is short and to the point. The applicant has a bachelor’s degree so that is included without high school information. If this person had certifications, those would also be listed here. This section is similar to the work experience one but is a bit briefer. As you see, no bullet points are used.
However, different applicants have unique needs. Those who are new to data visualization might want to include extra details about their education. Adding in your GPA, special projects related to data, and any honors are a good way to make this a larger part of a resume for those with minimal work experience.
How to Format This Section
Recruiters want to see specific things out of this section in a data visualization resume. You should list where you got your degree, what degree it was, and when you received it. The same applies to certifications except you may not need to include the location.
Reverse-chronological is still appropriate for this section. The last certification or degree you received should be up first. Then move through the past to list the others. Overall, this is a concise section for most people. The only exception is for those who are largely focusing on education instead of experience.
Section #5: Skills
Skills are a huge part of getting a position as a data visualization professional. Understanding the lifecycle of data is important so you should focus on technical skills. However, it’s also useful to list some communication skills. If you have project management experience or are good at problem-solving, those are also great to add.
While you might want to list all the things that you’re good at, you should mainly use things listed in the job description. If the skill doesn’t pertain to that job, you’ll probably want to leave it off your list of skills. Otherwise, add the things you excel at.
Skills Example
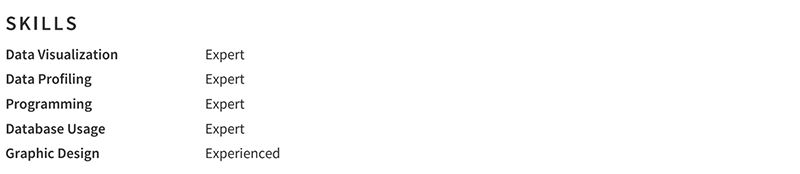
You can see one way to provide skills in the image above. Of course, every person and job is different so your skill section might have totally different items listed. To make it easier on you, here is a list of some common skills to include for a data visualization resume:
· Tableau Server
· Tableau Desktop
· Data Dashboards
· SQL
· SAP
· Data Integration
· Data Mining
· MySQL
· Python
· Data Analytics
· Oracle
· Graphic Design
· Data Modeling
· Data Warehousing
· Data Science
· SAS
· ETL
· JavaScript
· Teradata
Choose skills that you’re great at and focus on those. You want to keep the number reasonable though. A hiring manager is not going to want to read through a list composed of dozens of skills.
How to Format This Section
Formatting this part of your data visualization tools resume lets you be more creative. You’ll see in the image above that the skills are in a list form with information about how skilled you are in each of them. While this is in text format in the example, you can also visually represent your abilities.
Avoid making this a format other than a list. In most cases, five to 10 skills are more than enough. Think about what you’re adding and why it’s useful for the job. If you aren’t sure, there may be better information you can provide. Once you finish this up, you can move ahead to the final section of the data viz resume.
Section #6: References
Who knows about all the data visualization initiatives you’ve led and worked on? That’s right. The people you’ve worked with or learned from in the past. These are exactly the people you want to choose to display in the reference section of your resume. Think of managers, coworkers, professors, and others along this same line.
Not all references have to be from work or school, but it’s best to avoid listing friends or family members. It will be assumed that the information they give is biased since they’re close to you. Instead, think about people in the community who know you.
References Example
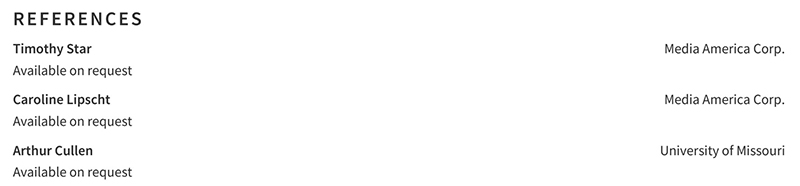
The reference example above is one of three tactics you can take. In this case, the applicant has chosen three references, although you can have as many as five. It gives information about who the person is, where they work, and how to get in contact with them. That’s pretty much all the detail you need to include.
How to Format This Section
The first way to format this section is by only leaving a line that says, “available on request.” We don’t recommend this since it’s lacking in substance. The second option is to include all the contact information. Unfortunately, this can run into issues with privacy if someone else sees the resume.
As such, the third choice is the one we believe works best. Go ahead and add names and companies but leave off the contact information. Instead, fill in a field with “available on request.” This gives more information about the references but requires the employer to contact you before screening your references.
Other Data-Related Resume Templates
Throughout this guide, we’ve been showing you one example of a resume template for data visualization experts. However, we offer others that can stand in and do the same thing for you. The links below are designed for other data positions. You can choose the one you like best and adapt it to your needs.
While you can make your own resume in Microsoft Word or other programs, it will take more time and effort than using a template. If you want a quick method to get your application in and seen by someone, use our resume builder for the most convenient method available.
Final Points on Writing the Best Resume for Data Visualization
A lot goes into making the perfect data visualization resume. With the tips, samples, and examples above, you should be well-equipped to get started. Use the full resume to get an idea of what yours should look like and fine-tune it before sending it in. Add in your cover letter and you’ll be ready to shake up the office with your resume.
Take time to craft a great resume with details, an enlightening objective, and good information in other sections. Pay attention to the details and only turn the resume in when it looks great. It could be the key to a great job that pays well and offers amazing benefits. Good luck!